Q1FY2020 Result Update | Banking
July 23, 2019
HDFC Bank
BUY
CMP
`2,264
Stable Q1; Higher Provisions mar performance
Target Price
`2,620
Particulars (` cr)
Q1FY20
Q4FY19
% chg (qoq)
Q1FY19
% chg (yoy)
Investment Period
12 Months
NII
13,294
13,089
1.6
10,814
22.9
Pre-prov. profit
11,147
10,844
2.8
8,648
28.9
PAT
5,568
5,885
(5.4)
4,601
21.0
Stock Info
Source: Company
Sector
Banking
For Q1FY2020, HDFC Bank has reported a very strong set of operating numbers
Market Cap (` cr)
6,27,741
yet again coupled with stable GNPA/NPA. However, provision for unsecured
Beta
0.8
credit and agri loan spiked, which led to jump in credit cost by 34bps/33.8bps on
52 Week High / Low
2,503/1,885
yoy/qoq basis. Loan growth moderated to 17.1% yoy (~24% in past three
Avg. Daily Volume
1,91,345
quarters) led by moderating auto loans and base effect in the unsecured segment.
Advances growth moderated: Softening of auto loan segment (contributes 28% of
Face Value (`)
2
retail loans), which grew 9% yoy (flat qoq) led to moderate growth in advances.
BSE Sensex
38,031
Personal and credit card loan have reported very healthy growth of 25% and
Nifty
11,345
28% yoy respectively. However, it is slower than historical growth rate of 35% yoy.
Reuters Code
HDBK.BO
Deposits grew at 18.5% yoy (3.4% qoq) owing to 22.5% yoy growth in term
deposit. CASA mix declined 270bps qoq to 39.7% (42.4% in 4QFY2019).
Bloomberg Code
HDFCB IN
Core income under pressure, cost/income declines: Total other income grew at
healthy rate of 30% yoy led by treasury gains. However, core fees barely grew at
12% primarily owing to plunge in mutual fund distribution fees and decline in
Shareholding Pattern (%)
disbursement in the unsecured book. Opex grew at
18.9% yoy (flat qoq),
Promoters
21.3
primarily led by higher employee expenses (+22.5% yoy). Further, the cost-to-
core income ratio declined by
192bps/70bps on yoy/qoq basis to
39%.
MF / Banks / Indian Fls
13.9
Management has guided 300bps declined in C/I over the next 3-5 years.
Provisions spiked: During the quarter, the key monitorable was spike in provision
FII / NRIs / OCBs
31.4
expenses i.e. 60%/38% on yoy/qoq basis. This was largely led by (a) agri
portfolio, (b) step-up provision towards unsecured loan, (earlier the bank used to
Indian Public / Others
14.7
take write-off between 150-180 dpd, now provides 100% within 150dpd, (c)
contingent provision worth of `165cr, and (d) growth in balance sheet size.
Ongoing slowdown in auto segment and subdued environment in real estate has
Abs. (%)
3m
1yr
3yr
impacted the HDB financials. GNPA/NNPA was at
2.3%/1.7% (jump of
Sensex
(2.6)
3.6
36.8
50bps/40bps qoq), largely NPA increased in construction finance segment. HDFC
Securities' PAT declined by 8% qoq.
HDFC Bank
0.8
6.5
86.5
Outlook & Valuation: Credit growth beat the industry growth rate driven by strong
retail business. The strong liability franchise and healthy capitalisation provides
earnings visibility. We value HDFC Bank using SOTP method, valuing standalone
banking business at 3.5x of FY21 ABV and its two subsidiaries at `147/share. We
recommend a Buy on the stock, with a target price of `2,620/ share.
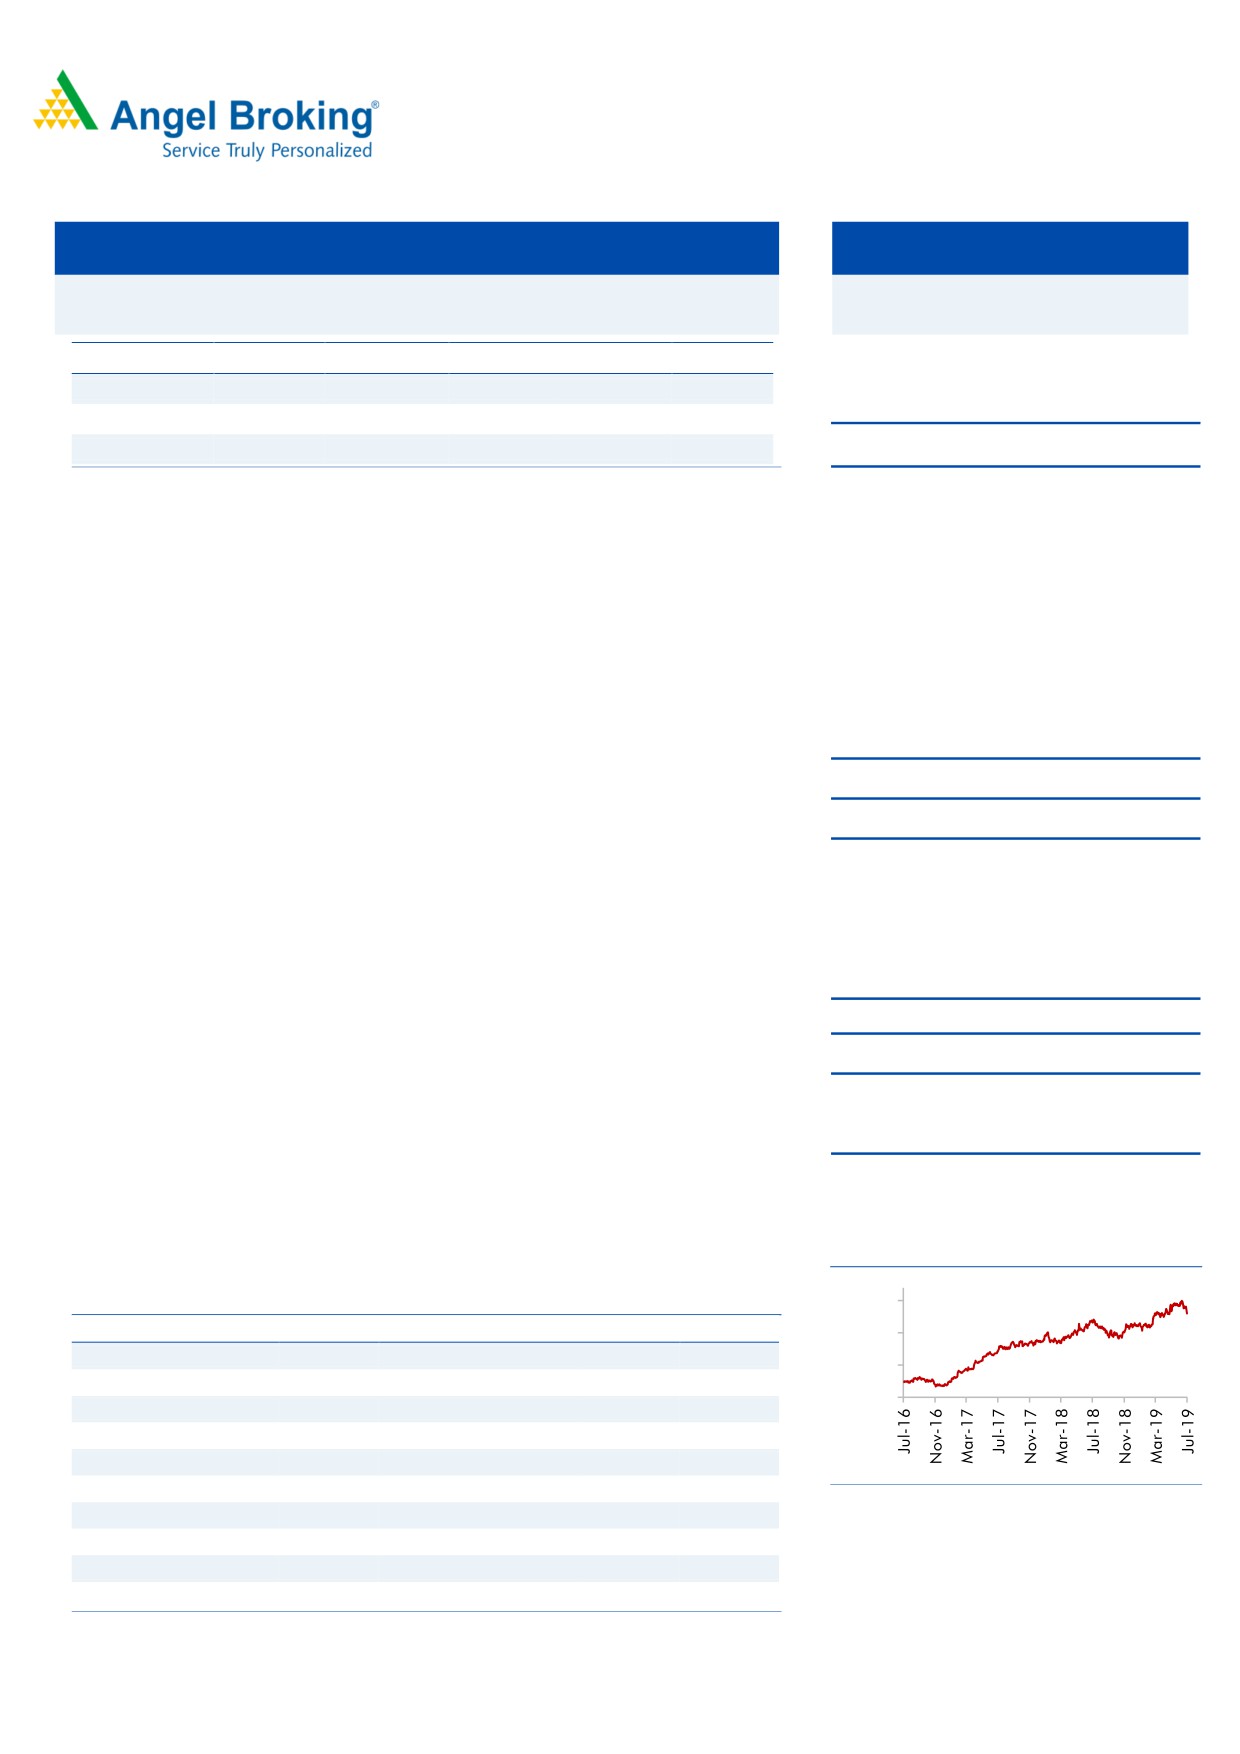
3-Year Price Chart
Key Performance
2,500
Y/E March (` cr)
FY17
FY18
FY19
FY20E
FY21E
2,000
NII
33,139
40,092
48,243
57,795
68,500
1,500
% chg
20.1
21.0
20.3
19.8
18.5
1,000
Net profit
14,549
17,486
21,078
24,915
30,149
% chg
18.3
20.2
20.5
18.2
21.0
NIM (%)
4.5
4.4
4.4
4.4
4.4
EPS ( Rs)
56.8
67.5
77.4
91.2
110.3
Source: Company
P/E (x)
39.9
33.6
29.3
24.9
20.5
P/ABV (x)
6.8
5.6
4.3
3.7
3.2
Jaikishan Parmar
RoA (%)
1.9
1.8
1.8
1.8
1.9
Research Analyst
RoE (%)
18.3
18.2
16.8
15.8
16.5
022 - 39357600 Ext: 6810
Source: Company, Angel Research; Note: CMP as of July 23, 2019
Please refer to important disclosures at the end of this report
1
HDFC Bank| Q1FY2020 Result Update
Exhibit 1: Quarterly Performance
Particulars (` cr)
Q3FY18
Q4FY18
Q1FY19
Q2FY19
Q3FY19
Q4FY19
Q1FY20
% YoY
% QoQ
Interest earned
20,581
21,319
22,549
24,200
25,890
26,333
27,392
21.5
4.0
- on Advances / Bills
16,157
16,663
17,391
18,828
20,306
21,019
21,805
25.4
3.7
- on investments
4,100
4,222
4,589
5,042
5,319
5,047
5,248
14.3
4.0
- on bal with RBI
112
196
332
94
98
112
175
(47.3)
57.1
- on others
212
238
237
236
167
155
164
(30.7)
5.5
Interest Expended
10,267
10,663
11,735
12,436
13,314
13,244
14,097
20.1
6.4
Net Interest Income
10,314
10,656
10,814
11,763
12,577
13,089
13,294
22.9
1.6
Other income
3,868
4,229
3,818
4,016
4,921
4,871
4,970
30.2
2.0
- Fee & comm
2,872
3,330
3,171
3,296
3,647
3,692
3,552
12.0
(3.8)
- Treasury income
259
(22)
(283)
(33)
474
229
212
(174.9)
(7.4)
- Forex & derivative
426
416
500
420
398
403
577
15.4
42.9
Others
311
505
431
333
403
547
630
46.3
15.2
C/I%
40.4
40.6
41
39.9
38.4
39.6
39.0
(192.9)bp
(65.8)bp
Operating income
14,182
14,885
14,632
15,779
17,498
17,961
18,264
24.8
1.7
Operating exp
5,732
6,050
5,984
6,299
6,719
7,117
7,117
18.9
0.0
- Employee exp
1,691
1,741
1,811
1,909
1,968
2,074
2,217
22.5
6.9
- Other Opex
4,041
4,309
4,173
4,390
4,752
5,043
4,900
17.4
(2.8)
Pre-provision Profit
8,450
8,835
8,648
9,480
10,779
10,844
11,147
28.9
2.8
Provisions & Cont
1,351
1,541
1,629
1,820
2,212
1,889
2,614
60.4
38.3
PBT
7,099
7,294
7,018
7,660
8,567
8,954
8,533
21.6
(4.7)
Provision for Tax
2,457
2,495
2,417
2,654
2,981
3,069
2,965
22.7
(3.4)
PAT
4,641
4,799
4,601
5,006
5,586
5,885
5,568
21.0
(5.4)
Effective Tax Rate (%)
35
34
34
35
35
34
35
31.4bp
47.4bp
Balance sheet
Advance
6,31,215
6,58,333
7,08,649
7,50,838
7,80,951
8,19,401
8,29,730
17.1
1.3
Borrowing
1,03,867
1,23,105
1,21,024
1,42,719
1,23,460
1,17,085
1,00,894
(16.6)
(13.8)
Deposit
6,99,026
7,88,770
8,05,785
8,33,364
8,52,502
9,23,141
9,54,554
18.5
3.4
CA
1,01,286
1,19,283
1,09,297
1,15,131
1,11,905
1,42,498
1,25,663
15.0
(11.8)
SA
2,05,833
2,23,810
2,26,656
2,34,568
2,35,179
2,48,700
2,53,338
11.8
1.9
CASA
3,07,119
3,43,093
3,35,953
3,49,699
3,47,084
3,91,198
3,79,001
12.8
(3.1)
CASA%
43.9
43.5
41.7
42.0
40.7
42.4
39.7
(198.8)bp
(267.2)bp
CA%
14.5
15.1
13.6
13.8
13.1
15.4
13.2
(39.9)bp
(227.2)bp
SA%
29.4
28.4
28.1
28.1
27.6
26.9
26.5
(158.9)bp
(40.1)bp
NIM (Reported)%
4.3
4.3
4.2
4.3
4.3
4.4
4.3
10bp
(10)bp
Source: Company
July 23, 2019
2
HDFC Bank| Q1FY2020 Result Update
Exhibit 2: Profitability
Particulars (%)
Q3FY18
Q4FY18
Q1FY19
Q2FY19
Q3FY19
Q4FY19
Q1FY20
% YoY
% QoQ
Advance Yield
10.5
10.3
10.18
10.32
10.61
10.51
10.58
40bp
7bp
Investment Yield
6.9
7.1
7.1
7.0
7.3
7.1
7.1
3.7bp
4.7bp
NIM
4.60
4.42
4.20
4.37
4.51
4.54
4.42
22.4bp
(11.1)bp
COF
5.2
5.0
5.11
5.23
5.46
5.25
5.38
27.5bp
12.7bp
Spread
5.3
5.4
5.1
5.1
5.1
5.3
5.2
12.4bp
(5.6)bp
RoA
1.97
1.9
1.7
1.8
1.9
1.95
1.79
7.6bp
(15.8)bp
RoE
17.9
18.1
17.2
16.4
15.9
16.1
14.6
(259.3)bp
(150.2)bp
Source: Company
Exhibit 3: Advance detail as per internal classification
Particular (` Cr)
Q3FY18
Q4FY18
Q1FY19
Q2FY19
Q3FY19
Q4FY19
Q1FY20
% YoY
% QoQ
Auto
82,510
85,974
88,320
91,920
93,023
91,383
92,086
4.3
0.8
Two Wheelers
9,220
9,648
10,324
11,290
11,369
11,271
11,334
9.8
0.6
CV/CE
42,548
45,939
47,167
49,548
52,880
55,429
55,200
17.0
(0.4)
Sub-total - Auto Loans
1,34,278
1,41,561
1,45,811
1,52,758
1,57,272
1,58,083
1,58,620
8.8
0.3
Personal Loans
67,490
72,442
78,542
84,145
89,550
93,806
97,986
24.8
4.5
Home Loans
38,130
36,265
44,036
47,875
51,799
51,372
55,781
26.7
8.6
Business Banking
1,00,810
1,09,507
1,09,551
1,17,039
1,20,429
1,25,014
1,26,099
15.1
0.9
Kisan Gold Card
31,307
35,497
33,783
37,068
36,349
40,362
38,556
14.1
(4.5)
Credit Cards
33,622
36,115
38,792
40,535
44,839
46,630
49,523
27.7
6.2
Others
18,061
17,791
20,362
21,023
22,403
22,771
22,310
9.6
(2.0)
Gold Loans
5,299
5,399
5,529
5,701
5,760
5,838
5,924
7.1
1.5
LAS
3,458
3,866
3,552
3,580
3,455
3,598
3,350
(5.7)
(6.9)
Total Retail Advances
4,32,455
4,58,443
4,79,958
5,09,724
5,31,856
5,47,474
5,58,149
16.3
1.9
Corp& International
1,98,760
1,99,890
2,28,691
2,41,114
2,49,095
2,71,927
2,71,581
18.8
(0.1)
Total loans
6,31,215
6,58,333
7,08,649
7,50,838
7,80,951
8,19,401
8,29,730
17.1
1.3
Retail (%)
69
70
68
68
68
67
67
(46)bp
45.5bp
Corporate (%)
31
30
32
32
32
33
33
46bp
(45.5)bp
Source: Company
Exhibit 4: GNPA/NPA stable however Provision increased due to unsecured loan
Particular
Q3FY18
Q4FY18
Q1FY19
Q2FY19
Q3FY19
Q4FY19
Q1FY20
% YoY
% QoQ
GNPA
8,235
8,607
9,539
10,098
10,903
11,224
11,769
23.4
4.9
GNPA
2,774
2,601
2,907
3,028
3,302
3,215
3,567
22.7
11.0
GNPA%
1.3
1.3
1.3
1.33
1.38
1.36
1.40
5.4bp
4bp
NPA%
0.44
0.40
0.41
0.40
0.42
0.39
0.43
2bp
4bp
Slippage (%) Annl
2.9
1.70
2.0
2.3
2.0
1.75
2.04
1.6bp
28.9bp
Slippages
4,588
2,790
3,580
4,333
4,000
3,580
4,225
18.0
18.0
Credit Cost (%)
0.86
0.94
0.92
0.97
1.13
0.92
1.26
34bp
33.8bp
Provision Calc
66.15
69.47
69.52
69.92
69.57
71.32
69.29
(23.7)bp
(203.8)bp
Source: Company
July 23, 2019
3
HDFC Bank| Q1FY2020 Result Update
Outlook & Valuation: Credit growth beat the industry growth rate driven by strong
retail business. The strong liability franchise and healthy capitalisation provides
earnings visibility. We value HDFC Bank using SOTP method, valuing standalone
banking business at 3.4x of FY21 ABV and its two subsidiaries at `147/share. We
recommend a Buy on the stock, with a target price of `2,620/share.
Exhibit 5: Valuation Summary
Valuation
Value/share
Particulars
%
Methodology
(`)
Value of HDFC Bank standalone
100
3.5x FY21E ABV
2488
Subsidiaries
HDB Fin
96%
3.5x FY21E ABV
126
HDFC Sec
98% 15x of FY21 PAT
21
Less: Cost of investments
(14)
Fair value per share
2620
Source: Company
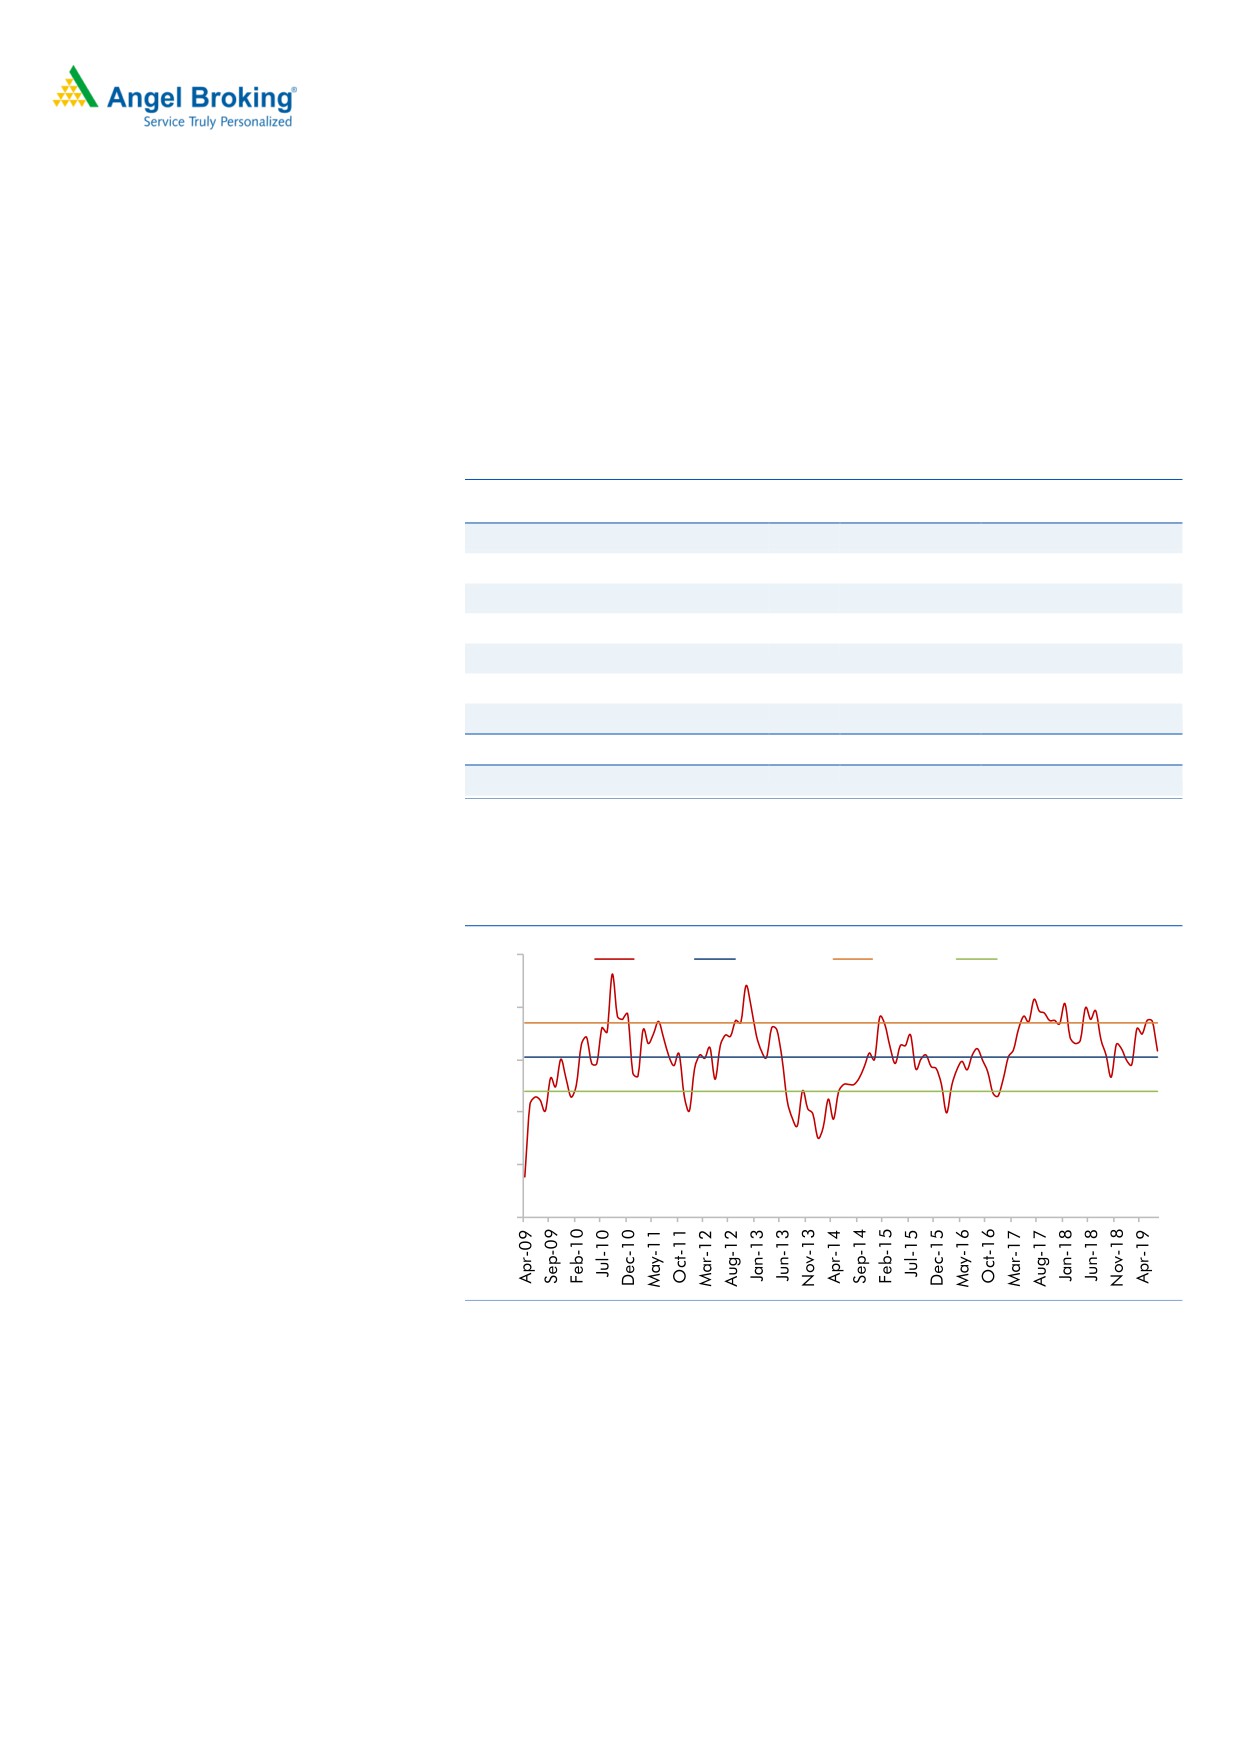
Exhibit 6: One year forward P/BV (x)
4.5
P/BV
Avg. P/BV
+1STD
-1STD
4
3.85
3.52
3.5
3.19
3
2.5
2
Source: Company
July 23, 2019
4
HDFC Bank| Q1FY2020 Result Update
Income Statement (Standalone)
Y/E March (` cr)
FY17
FY18
FY19
FY20E
FY21E
Net Interest Income
33,139
40,092
48,243
57,795
68,500
- YoY Growth (%)
20.1
21.0
20.3
19.8
18.5
Other Income
12,296
15,221
17,626
20,459
23,793
- YoY Growth (%)
14.4
23.8
15.8
16.1
16.3
Operating Income
45,435
55,313
65,869
78,254
92,293
- YoY Growth (%)
18.5
21.7
19.1
18.8
17.9
Operating Expenses
19,703
22,690
26,119
30,331
35,464
- YoY Growth (%)
16.0
15.2
15.1
16.1
16.9
Pre - Provision Profit
25,732
32,623
39,750
47,923
56,829
- YoY Growth (%)
20.4
26.8
21.8
20.6
18.6
Prov. & Cont.
3,593
5,927
7,550
10,514
11,830
- YoY Growth (%)
31.8
65.0
27.4
39.3
12.5
Profit Before Tax
22,139
26,696
32,200
37,409
44,999
- YoY Growth (%)
18.8
20.6
20.6
16.2
20.3
Prov. for Taxation
7,589
9,210
11,122
12,494
14,850
- as a % of PBT
34.3
34.5
34.5
33.4
33.0
PAT
14,549
17,486
21,078
24,915
30,149
- YoY Growth (%)
18.3
20.2
20.5
18.2
21.0
Balance sheet (Standalone)
Y/E March (` cr)
FY17
FY18
FY19
FY20E
FY21E
Share Capital
513
518
545
547
547
Reserves & Surplus
85,502
1,05,776
1,44,360
1,69,802
1,95,155
Net Worth
86,014
1,06,294
1,44,905
1,70,348
1,95,702
Deposits
6,43,640
7,88,770
9,23,141
11,07,769
13,29,323
- Growth (%)
17.8
22.5
17.0
20.0
20.0
Borrowings
74,029
1,23,105
1,17,085
1,10,777
1,32,932
Other Liab & Prov.
56,709
45,764
55,108
66,466
79,759
Total Liabilities
8,60,392
10,63,933
12,40,239
14,55,361
17,37,716
Cash balances
37,897
1,04,670
46,764
60,927
73,113
Bank balances
11,055
18,244
34,584
17,724
21,269
Investments
2,14,463
2,42,200
2,90,588
3,65,564
4,38,677
Advances
5,54,568
6,58,333
8,19,401
9,83,281
11,79,938
- Growth (%)
19.4
18.7
24.5
20.0
20.0
Fixed Assets
3,627
3,607
4,030
6,868
8,242
Other Assets
38,782
36,879
44,873
20,995
16,478
Total Assets
8,60,392
10,63,933
12,40,239
14,55,361
17,37,716
- Growth (%)
21.4
23.7
16.6
17.3
19.4
July 23, 2019
5
HDFC Bank| Q1FY2020 Result Update
Ratio analysis (Standalone)
Y/E March
FY17
FY18
FY19
FY20E
FY21E
Profitability Ratios (%)
NIMs
4.46
4.35
4.36
4.41
4.36
Cost to Income Ratio
43.4
41.0
39.7
38.8
38.4
RoA
1.9
1.8
1.8
1.8
1.9
RoE
18.3
18.2
16.8
15.8
16.5
B/S ratios (%)
CASA Ratio
48.0
43.5
42.4
45.0
45.0
Credit/Deposit Ratio
86.2
83.5
88.8
88.8
88.8
Asset Quality (%)
Gross NPAs
1.1
1.3
1.3
1.3
1.3
Net NPAs
0.3
0.4
0.4
0.4
0.4
Slippages
1.5
1.5
2.2
2.0
2.0
Loan Loss Prov./Avg. Assets
0.6
0.9
0.9
1.1
1.0
Provision Coverage
69
69
69
69
69
Per Share Data (`)
EPS
56.8
67.5
77.4
91.2
110.3
BVPS
336
410
532
623
716
ABVPS
334
407
528
619
711
DPS
11.5
13.5
13.5
14.5
15.0
Valuation Ratios
PER (x)
39.9
33.6
29.3
24.9
20.5
P/BVPS (x)
6.8
5.5
4.3
3.6
3.2
P/ABVPS (x)
6.8
5.6
4.3
3.7
3.2
Dividend Yield
0.5
0.6
0.6
0.6
0.7
DuPont Analysis (%)
FY17
FY18
FY19E
FY20E
FY21E
Interest Income
8.83
8.34
8.59
8.88
9.05
Interest Expenses
4.61
4.17
4.40
4.60
4.76
NII
4.22
4.17
4.19
4.29
4.29
Non Interest Income
1.57
1.58
1.53
1.52
1.49
Total Revenues
5.79
5.75
5.72
5.81
5.78
Operating Cost
2.51
2.36
2.27
2.25
2.22
PPP
3.28
3.39
3.45
3.56
3.56
Total Provisions
0.46
0.62
0.66
0.78
0.74
PreTax Profit
2.82
2.77
2.79
2.78
2.82
Tax
0.97
0.96
0.97
0.93
0.93
ROA
1.85
1.82
1.83
1.85
1.89
Leverage
9.89
10.01
9.17
8.55
8.72
RoE (%)
18.34
18.19
16.78
15.81
16.47
Valuation done on closing price of 23/7/2019
July 23, 2019
6
HDFC Bank| Q1FY2020 Result Update
Research Team Tel: 022 - 39357800
Angel Broking Limited (hereinafter referred to as “Angel”) is a registered Member of National Stock Exchange of India Limited, Bombay
Stock Exchange Limited, Metropolitan Stock Exchange Limited, Multi Commodity Exchange of India Ltd and National Commodity &
Derivatives Exchange Ltd It is also registered as a Depository Participant with CDSL and Portfolio Manager and Investment Adviser with
SEBI. It also has registration with AMFI as a Mutual Fund Distributor. Angel Broking Limited is a registered entity with SEBI for Research
Analyst in terms of SEBI (Research Analyst) Regulations, 2014 vide registration number INH000000164. Angel or its associates has not
been debarred/ suspended by SEBI or any other regulatory authority for accessing /dealing in securities Market. Angel or its
associates/analyst has not received any compensation / managed or co-managed public offering of securities of the company covered
by Analyst during the past twelve months.
This document is solely for the personal information of the recipient, and must not be singularly used as the basis of any investment
decision. Nothing in this document should be construed as investment or financial advice. Each recipient of this document should
make such investigations as they deem necessary to arrive at an independent evaluation of an investment in the securities of the
companies referred to in this document (including the merits and risks involved), and should consult their own advisors to determine
the merits and risks of such an investment.
Reports based on technical and derivative analysis center on studying charts of a stock's price movement, outstanding positions and
trading volume, as opposed to focusing on a company's fundamentals and, as such, may not match with a report on a company's
fundamentals. Investors are advised to refer the Fundamental and Technical Research Reports available on our website to evaluate the
contrary view, if any
The information in this document has been printed on the basis of publicly available information, internal data and other reliable
sources believed to be true, but we do not represent that it is accurate or complete and it should not be relied on as such, as this
document is for general guidance only. Angel Broking Limited or any of its affiliates/ group companies shall not be in any way
responsible for any loss or damage that may arise to any person from any inadvertent error in the information contained in this report.
Angel Broking Limited has not independently verified all the information contained within this document. Accordingly, we cannot testify,
nor make any representation or warranty, express or implied, to the accuracy, contents or data contained within this document. While
Angel Broking Limited endeavors to update on a reasonable basis the information discussed in this material, there may be regulatory,
compliance, or other reasons that prevent us from doing so.
This document is being supplied to you solely for your information, and its contents, information or data may not be reproduced,
redistributed or passed on, directly or indirectly.
Neither Angel Broking Limited, nor its directors, employees or affiliates shall be liable for any loss or damage that may arise from or in
connection with the use of this information.
Disclosure of Interest Statement
HDFC Bank
1. Financial interest of research analyst or Angel or his Associate or his relative
No
2. Ownership of 1% or more of the stock by research analyst or Angel or associates or relatives
No
3. Served as an officer, director or employee of the company covered under Research
No
4. Broking relationship with company covered under Research
No
July 23, 2019
7